📊 Comprehensive Findings & Interpretations
1. Robust Upstream Causal Impact (ATE = 7.1744)
The DoWhy backdoor regression estimates a massive, statistically significant Average Treatment Effect of 7.1744 (p = 5.98 × 10-256) of soil health on gut health outcomes. Stress-testing via the Placebo Treatment Refuter successfully collapsed the effect size down to near-zero (-0.0190, p = 1.0), confirming that the estimated causal relationship is a true structural property rather than a statistical coincidence.
2. Pharmaceutical Disruption vs. Environmental Gradient
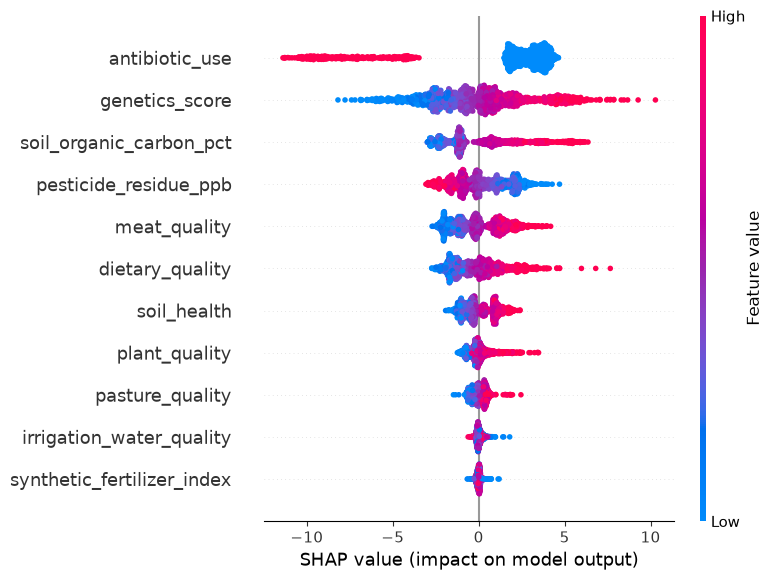
SHAP feature attribution identifies antibiotic_use as the primary predictive feature driver. High antibiotic use clusters heavily on the negative side of the SHAP impact axis (reducing health metrics by up to 10 points), demonstrating that acute pharmacological interventions exert a dominant disruptive force that can override baseline environmental gradients.
3. Multi-Trophic Mediated Cascades
Upstream nodes like soil organic carbon and pesticide residues show strong structured spreads in feature impact rankings. This validates the theoretical systems design: soil health impacts consumer health through sequential biological pathways—carbon accumulation, agrochemical reduction, and plant/meat nutritional quality—before culminating in final health metrics.
📋 Dataset Inspector (Sample Rows)
Inspection of the first 5 records from both the raw synthetic generation pipeline and the post-processed/scaled outputs.
1. Raw Dataset Sample (`data/soil_gut_dataset.csv`)
| soil_health | soil_organic_carbon_pct | irrigation_water_quality | synthetic_fertilizer_index | pesticide_residue_ppb | plant_quality | dietary_quality | pasture_quality | meat_quality | antibiotic_use | genetics_score | gut_health |
|---|---|---|---|---|---|---|---|---|---|---|---|
| 36.488108 | 2.925463 | 24.993892 | 76.778733 | 278.996950 | 8.958914 | 23.081021 | 15.098563 | 15.537048 | 0 | -2.499406 | 0.000000 |
| 42.098603 | 3.607802 | 20.244892 | 67.214152 | 260.034371 | 19.833843 | 13.184827 | 22.364050 | 20.234921 | 1 | 2.290943 | 0.000000 |
| 71.944564 | 5.621242 | 50.434822 | 44.632239 | 141.425813 | 40.543238 | 40.867127 | 41.369106 | 27.325547 | 0 | -1.389572 | 11.196501 |
| 41.033040 | 2.364463 | 13.937659 | 52.893088 | 265.600319 | 18.892296 | 2.916924 | 7.724492 | 12.786895 | 0 | -1.645399 | 0.000000 |
| 69.264126 | 5.324743 | 43.608554 | 31.827238 | 171.280042 | 43.413823 | 15.633281 | 45.487409 | 38.955968 | 0 | 1.022570 | 22.201638 |
2. Processed & Scaled Dataset Sample (`data/processed_soil_gut_dataset.csv`)
| soil_health | soil_organic_carbon_pct | irrigation_water_quality | synthetic_fertilizer_index | pesticide_residue_ppb | plant_quality | dietary_quality | pasture_quality | meat_quality | genetics_score | antibiotic_use | gut_health |
|---|---|---|---|---|---|---|---|---|---|---|---|
| -1.160630 | -1.100447 | -0.983820 | 1.148595 | 1.037144 | -1.560699 | 0.087205 | -1.420077 | -0.926524 | -2.581911 | 0 | 0.000000 |
| -0.878198 | -0.688178 | -1.266949 | 0.727778 | 0.814497 | -0.855458 | -0.720247 | -0.934095 | -0.541815 | 2.306563 | 1 | 0.000000 |
| 0.624249 | 0.528343 | 0.532934 | -0.265768 | -0.578131 | 0.487550 | 1.538412 | 0.337139 | 0.038836 | -1.449344 | 0 | 11.196501 |
| -0.931838 | -1.439403 | -1.642978 | 0.097688 | 0.879849 | -0.916518 | -1.558027 | -1.913324 | -1.151734 | -1.710411 | 0 | 0.000000 |
| 0.489316 | 0.349198 | 0.125961 | -0.829156 | -0.227601 | 0.673708 | -0.520472 | 0.612610 | 0.991251 | 1.012210 | 0 | 22.201638 |
📈 Causal Estimation (DoWhy)
Backdoor linear regression measuring the Average Treatment Effect (ATE) of soil health on gut outcomes.
Statistical Significance: p = 5.98e-256
Conditional Estimates Breakdown
__categorical__antibiotic_use  __categorical__genetics_score
(-0.001, 1.0]                  (-2.722, -0.854]                 5.491718
                               (-0.854, -0.248]                 6.653690
                               (-0.248, 0.261]                  7.175340
                               (0.261, 0.839]                   7.815889
                               (0.839, 2.694]                   8.735425
dtype: float64...
🛡️ Dual-Refutation Validation
Robustness stress-tests checking for hidden confounders and spurious correlations.
-
1. Placebo Treatment Refuter:
New effect =-0.0190(p-value: 1.0) Passed -
2. Random Common Cause Refuter:
New effect =7.1740(p-value: 0.92) Passed
🤖 Machine Learning & SHAP Feature Attribution
Feature impact rankings derived from the XGBoost regressor model across all 1,500 samples.
🗺️ Interactive Causal Network (DAG)
Multi-trophic directional mapping from soil management down to consumer health endpoints.
💡 Strategic Recommendations & Field Operational Roadmap
Written from the perspective of an Agronomist and Systems Ethnoecologist, outlining how a multidisciplinary field team translates these model recommendations on the ground.
Phase 1: Immediate Field-Level Prioritization (Month 1–3)
Focus: Isolating the biochemical mechanisms and managing primary disruptive variables.
- Agronomist View: The model highlights
antibiotic_useandpesticide_residue_ppbas dominant structural disruptors. As a first step, we establish controlled farm trials comparing regenerative management zones (zero-synthetic-input, cover-cropped) against conventional high-input baselines. - Action: Collect paired soil cores, forage tissue samples, and livestock gut microbiome swabs (via fecal metagenomics) across a gradient of pesticide application rates to map the exact accumulation curve of chemical residues from soil to animal.
- Agronomist View: Since
soil_healthacts as the primary master driver (ATE = 7.1744), we must move beyond general bulk-density and carbon percentages to identify which biological components drive the cascade. - Action: Deploy Phospholipid Fatty Acid (PLFA) analysis and ITS/16S amplicon sequencing on soil samples to measure active fungal-to-bacterial ratios, mycorrhizal colonization rates, and beneficial microbial biomass, correlating them directly with pasture nutritional density.
Phase 2: Mid-Term Systems Integration & Animal Husbandry (Month 4–12)
Focus: Tracing the multi-trophic nutritional cascade from forage to consumer.
- Ethnoecologist View: The model validates that soil health cascades through plant and pasture quality into animal and human gut outcomes. However, real-world diets are heterogeneous.
- Action: Implement a livestock tagging and dietary tracking protocol. Analyze phytonutrient profiles (secondary plant metabolites, omega-3/omega-6 fatty acid ratios, and polyphenol concentrations) of diverse pasture forages versus monoculture grain feeds. Track how specific phytonutrient cascades alter ruminant rumen microbiome composition and subsequent meat quality biomarkers.
- Agronomist View: Recommendations fail if they ignore farm economics. We must partner with working ranches and farms to test phased antibiotic reduction protocols.
- Action: Set up a Participatory Action Research (PAR) cohort with 10 livestock producers. Transition half to adaptive multi-paddock (AMP) grazing and targeted herbal/prophylactic livestock care to lower antibiotic dependency, measuring longitudinal resilience and gut health indices.
Phase 3: Long-Term Empirical Scaling & Policy (Year 1–3)
Focus: Replacing synthetic datasets with empirical multi-omics and updating regional standards.
- Ethnoecologist View: Synthetic models generate directional hypotheses, but real-world biological feedback loops are non-linear.
- Action: Build a unified Soil-to-Gut Bio-Repository combining metadata from:
- Soil: Metagenomics, organic carbon stratification, water retention capacity.
- Plant/Animal: Brix sweetness levels, forage antioxidant capacities, livestock blood metabolic panels.
- Human: Microbiome 16S sequencing from partner dietary cohorts consuming these regional outputs.
- Agronomist View: Linear regression assumes uniform effect sizes. Regenerative transitions feature tipping points and diminishing returns.
- Action: Upgrade the pipeline estimation engine from linear backdoor models to Causal Forests. Uncover heterogeneous treatment effects (HTE) to answer: "Does improving soil health yield exponential gut health improvements on degraded soils, but plateau on fertile lands?"
📝 Summary Action Checklist for Lead Agronomists
- Priority 1: Audit and segment current farm inputs (agrochemicals and antibiotics) to isolate baseline disruption.
- Priority 2: Launch empirical multi-omics sampling across the soil-forage-gut interface instead of relying solely on synthetic proxies.
- Priority 3: Partner with producers to pilot management shifts (AMP grazing, organic carbon building) and measure longitudinal resilience.